> }

Climate Data Hub

Climate Data Hub is a one-stop destination for developers looking to access and utilize various climate datasets. Join our growing developer community and unlock the potential of climate datasets to make a positive impact. Explore our portal, access our APIs, and together let's harness the power of climate data to create a sustainable future.

curl
api-usage

API Curl

Discover how to interact with our API using cURL commands, simplifying integration with your applications. View examples and syntax for easy implementation.

Pathname

Understand the structure of API endpoints and their corresponding pathnames. This section provides a detailed breakdown of available paths for accessing specific resources.

Method

Learn about the HTTP methods our API supports, including GET, POST, PUT, DELETE, and more. Discover which methods to use for various operations and interactions.

Response Summary

Get insights into the different response formats our API provides. Explore status codes and sample responses to ensure your applications can effectively handle our API's output.

Parameters

Explore the comprehensive list of parameters each API endpoint supports, facilitating customizable requests and tailored data retrieval.

Detailed API Usage

It allows subscribers to access comprehensive insights into their API utilization, including request statistics.

Quick Setup and Simple Interface

Streamline Your Climate Data Retrieval with few clicks

setup-api-key

API KEY

ONE API KEY FOR ALL THE DATASETS
setup-params

EXPLORE DOCS

GENERATE YOUR UNIQUE API KEY
setup-curl

REQUEST API

STUDY THE REQUEST
setup-payload

RESPONSES

ANALYSE THE API RESPONSES
setup-subs

USAGE

KEEP AN EYE ON YOUR USAGE

Temporal & Spatial Filters

filter-lat-long

SPATIAL

LONGITUDE & LATITUDE
filter-bucket

TIME BUCKETING

Daily, Weekly etc.
filter-duration

DURATION SELECTOR

1D, 3D, 1W, 6M ETC.
filter-lat-long

SPATIAL

LONGITUDE & LATITUDE
filter-bucket

TIME BUCKETING

Daily, Weekly etc.
filter-duration

DURATION SELECTOR

1D, 3D, 1W, 6M ETC.
about-read-docs

Easy-to-read docs

Climate Data Hub is your go-to resource for exploring our SDKs, diving deep into our APIs, and unleashing your creativity. We provide clear and concise documentation, comprehensive guides, interactive examples, API references, and regular updates to make your development journey a breeze. Our well-organized and structured API reference, enriched with interactive examples, ensures seamless integration of our services into your applications.

Response Samples

Save time and effort during integration by leveraging our response samples on how to handle data effectively. Efficiently parse and extract the data you need from our API using our comprehensive response samples. Whether JSON, XML, or any other format, our carefully crafted samples showcase API responses' typical structure and content. They provide relevant fields, data types, and example values, ensuring a clear understanding of available information. Unlock the full potential of our API and streamline your development workflow today!

about-response-samples

Metrics Monitors

The metrics Monitor tool enables the users to visualize the validation of all predictions generated by our Inference Engine on a regular frequency. This powerful feature compares the predictions against the ground truth data, ensuring accuracy and reliability. By regularly monitoring the performance of our predictions, we strive to deliver the most precise and trustworthy results to our users.

MAE

Mean Absolute Error

RMSE

Root Mean Square Error

MAE

Mean Absolute Error

The mean absolute error (MAE) calculates the average difference between the estimated values and actual values. It is calculated by adding up all the absolute errors and dividing them by the number of errors.

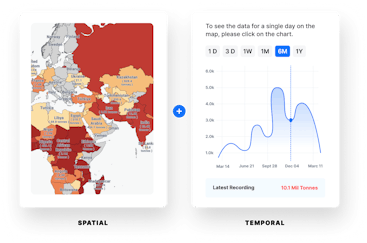
Spatial & Temporal Context

To effectively understand and utilize the vast amounts of climate data available, businesses today require a visualization platform enabling users to derive insights easily across multiple devices. Welcome to SpaceTime™ – a platform that visualises insights with detailed spatial and temporal context.

What is spacetime?

Tired of seeing endless maps and graphs?
Meet SpaceTime™, A tool that blends both to provide a seamless, complete and multi-dimensional picture of Earth.
Inspired by Albert Einstein's Special Theory of Relativity, the name SpaceTime™ can be split into two parts: space and time, which respectively represent the spatial and temporal components of everything.
Imagine it as a Digital twin of the world for climate and environmental data, where you can move around in space & time to see the future, past, or present - just like a time machine.

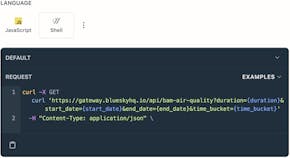
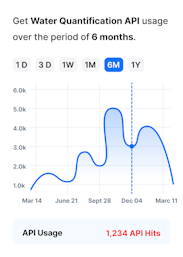
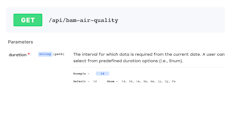
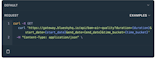
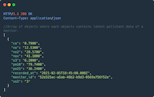
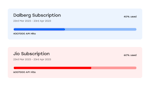
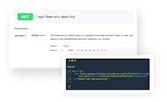
Visualise diverse datasets, including vector and raster data, focusing on climate-change-related parameters generated by Blue Sky Analytics. Before diving deep into APIs, Visualize the available products, or configure and use Embed or export GIFs with a single click.

Learn More
spatial-temporal-context
dataset-AGB

Looking for a dataset?

Discover an extensive range of climate datasets on our product page, designed to cater to your diverse data needs. By leveraging our climate datasets, you can access a wealth of information that can facilitate climate modeling, trend analysis, risk assessment, and decision-making processes. Stay at the forefront of climate research and analysis with our diverse and reliable climate datasets.

Above Ground Biomass
Subscribe to our Newsletter
BSA Logo

Blue Sky Analytics is a geospatial data intelligence company building a API based catalogue of Environmental Datasets by leveraging Satellite data, AI and cloud.


2024 Xacmaz Technology Pvt. Ltd. All Rights Reserved.

socialsocialsocialsocialsocial