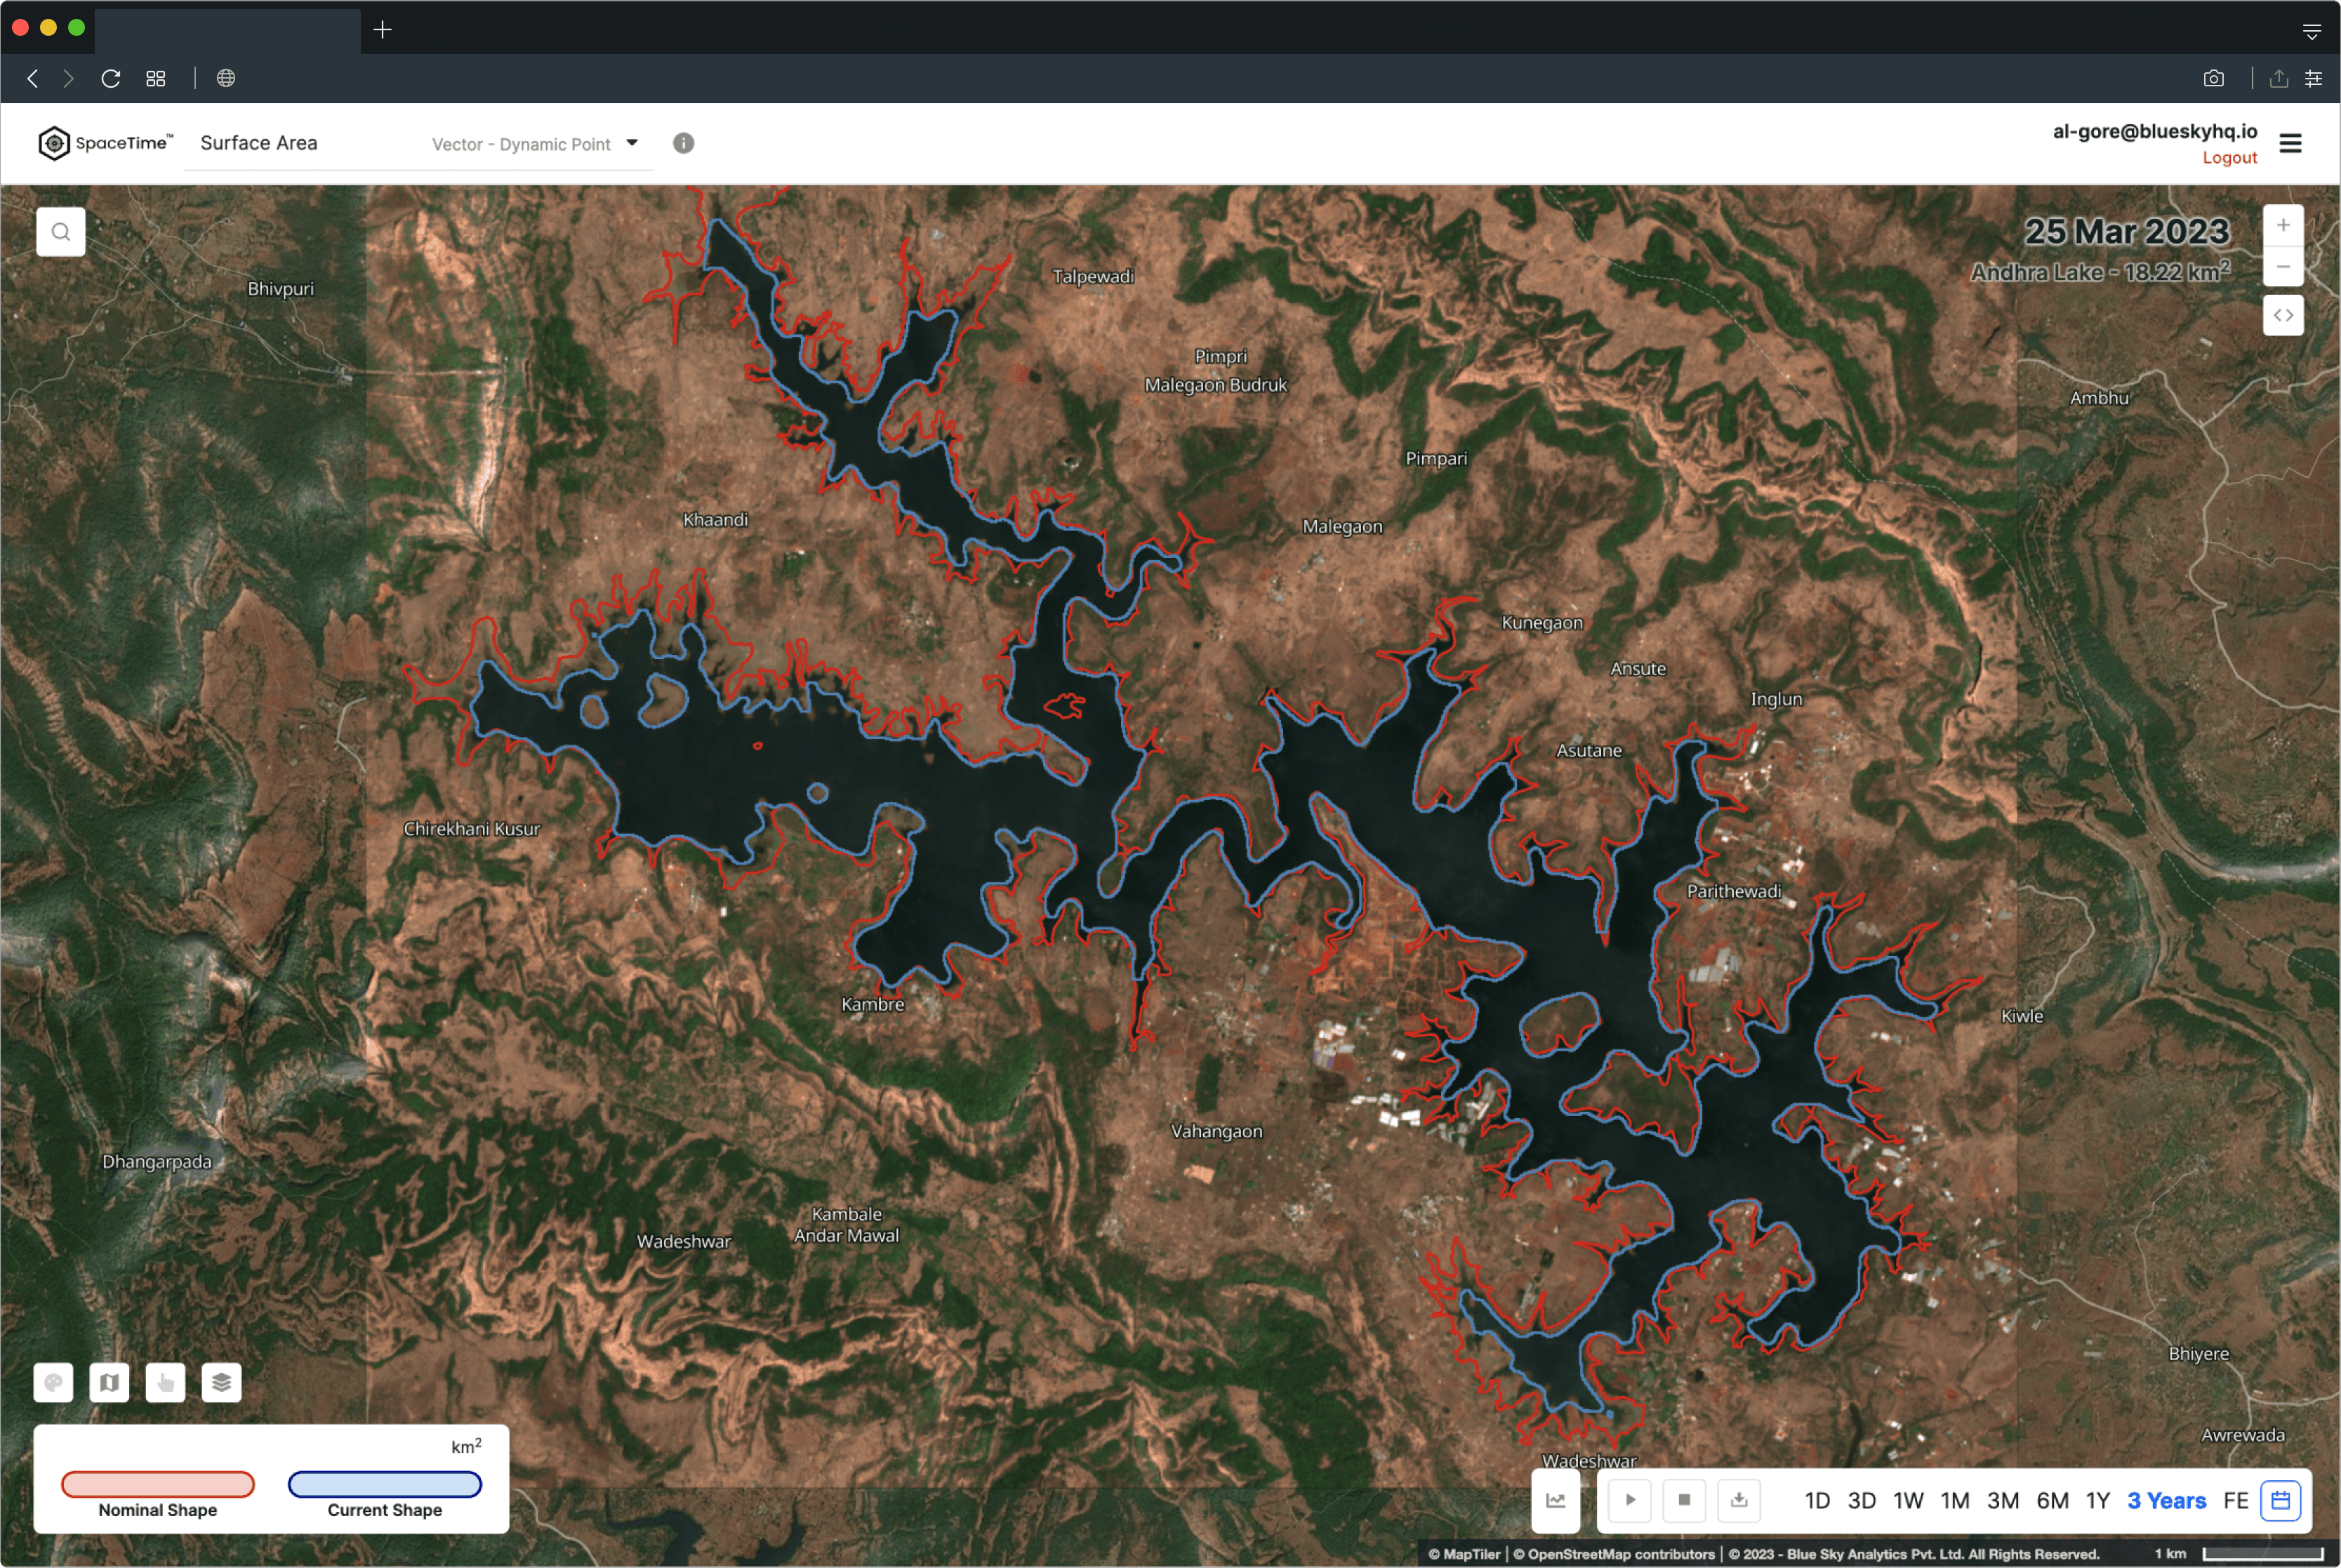
SpaceTime™
Digital Twin of Earth.
Visualise business-ready and actionable environmental insights using our proprietary and AI-powered datasets with a detailed spatial and temporal context.
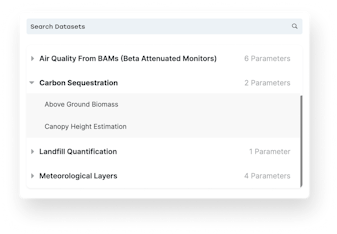
Dataset Selector
Our dataset selector enables users to explore and search through a variety of datasets, each containing multiple parameters.
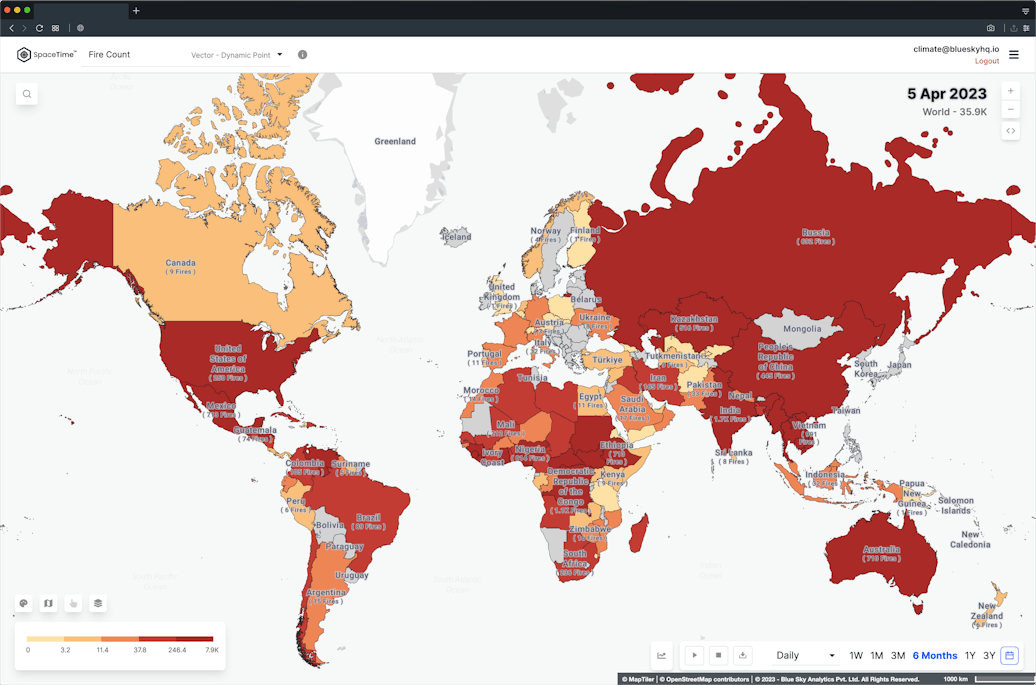
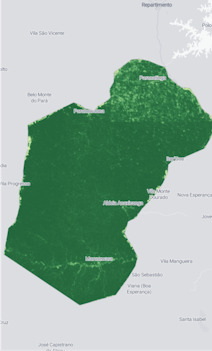
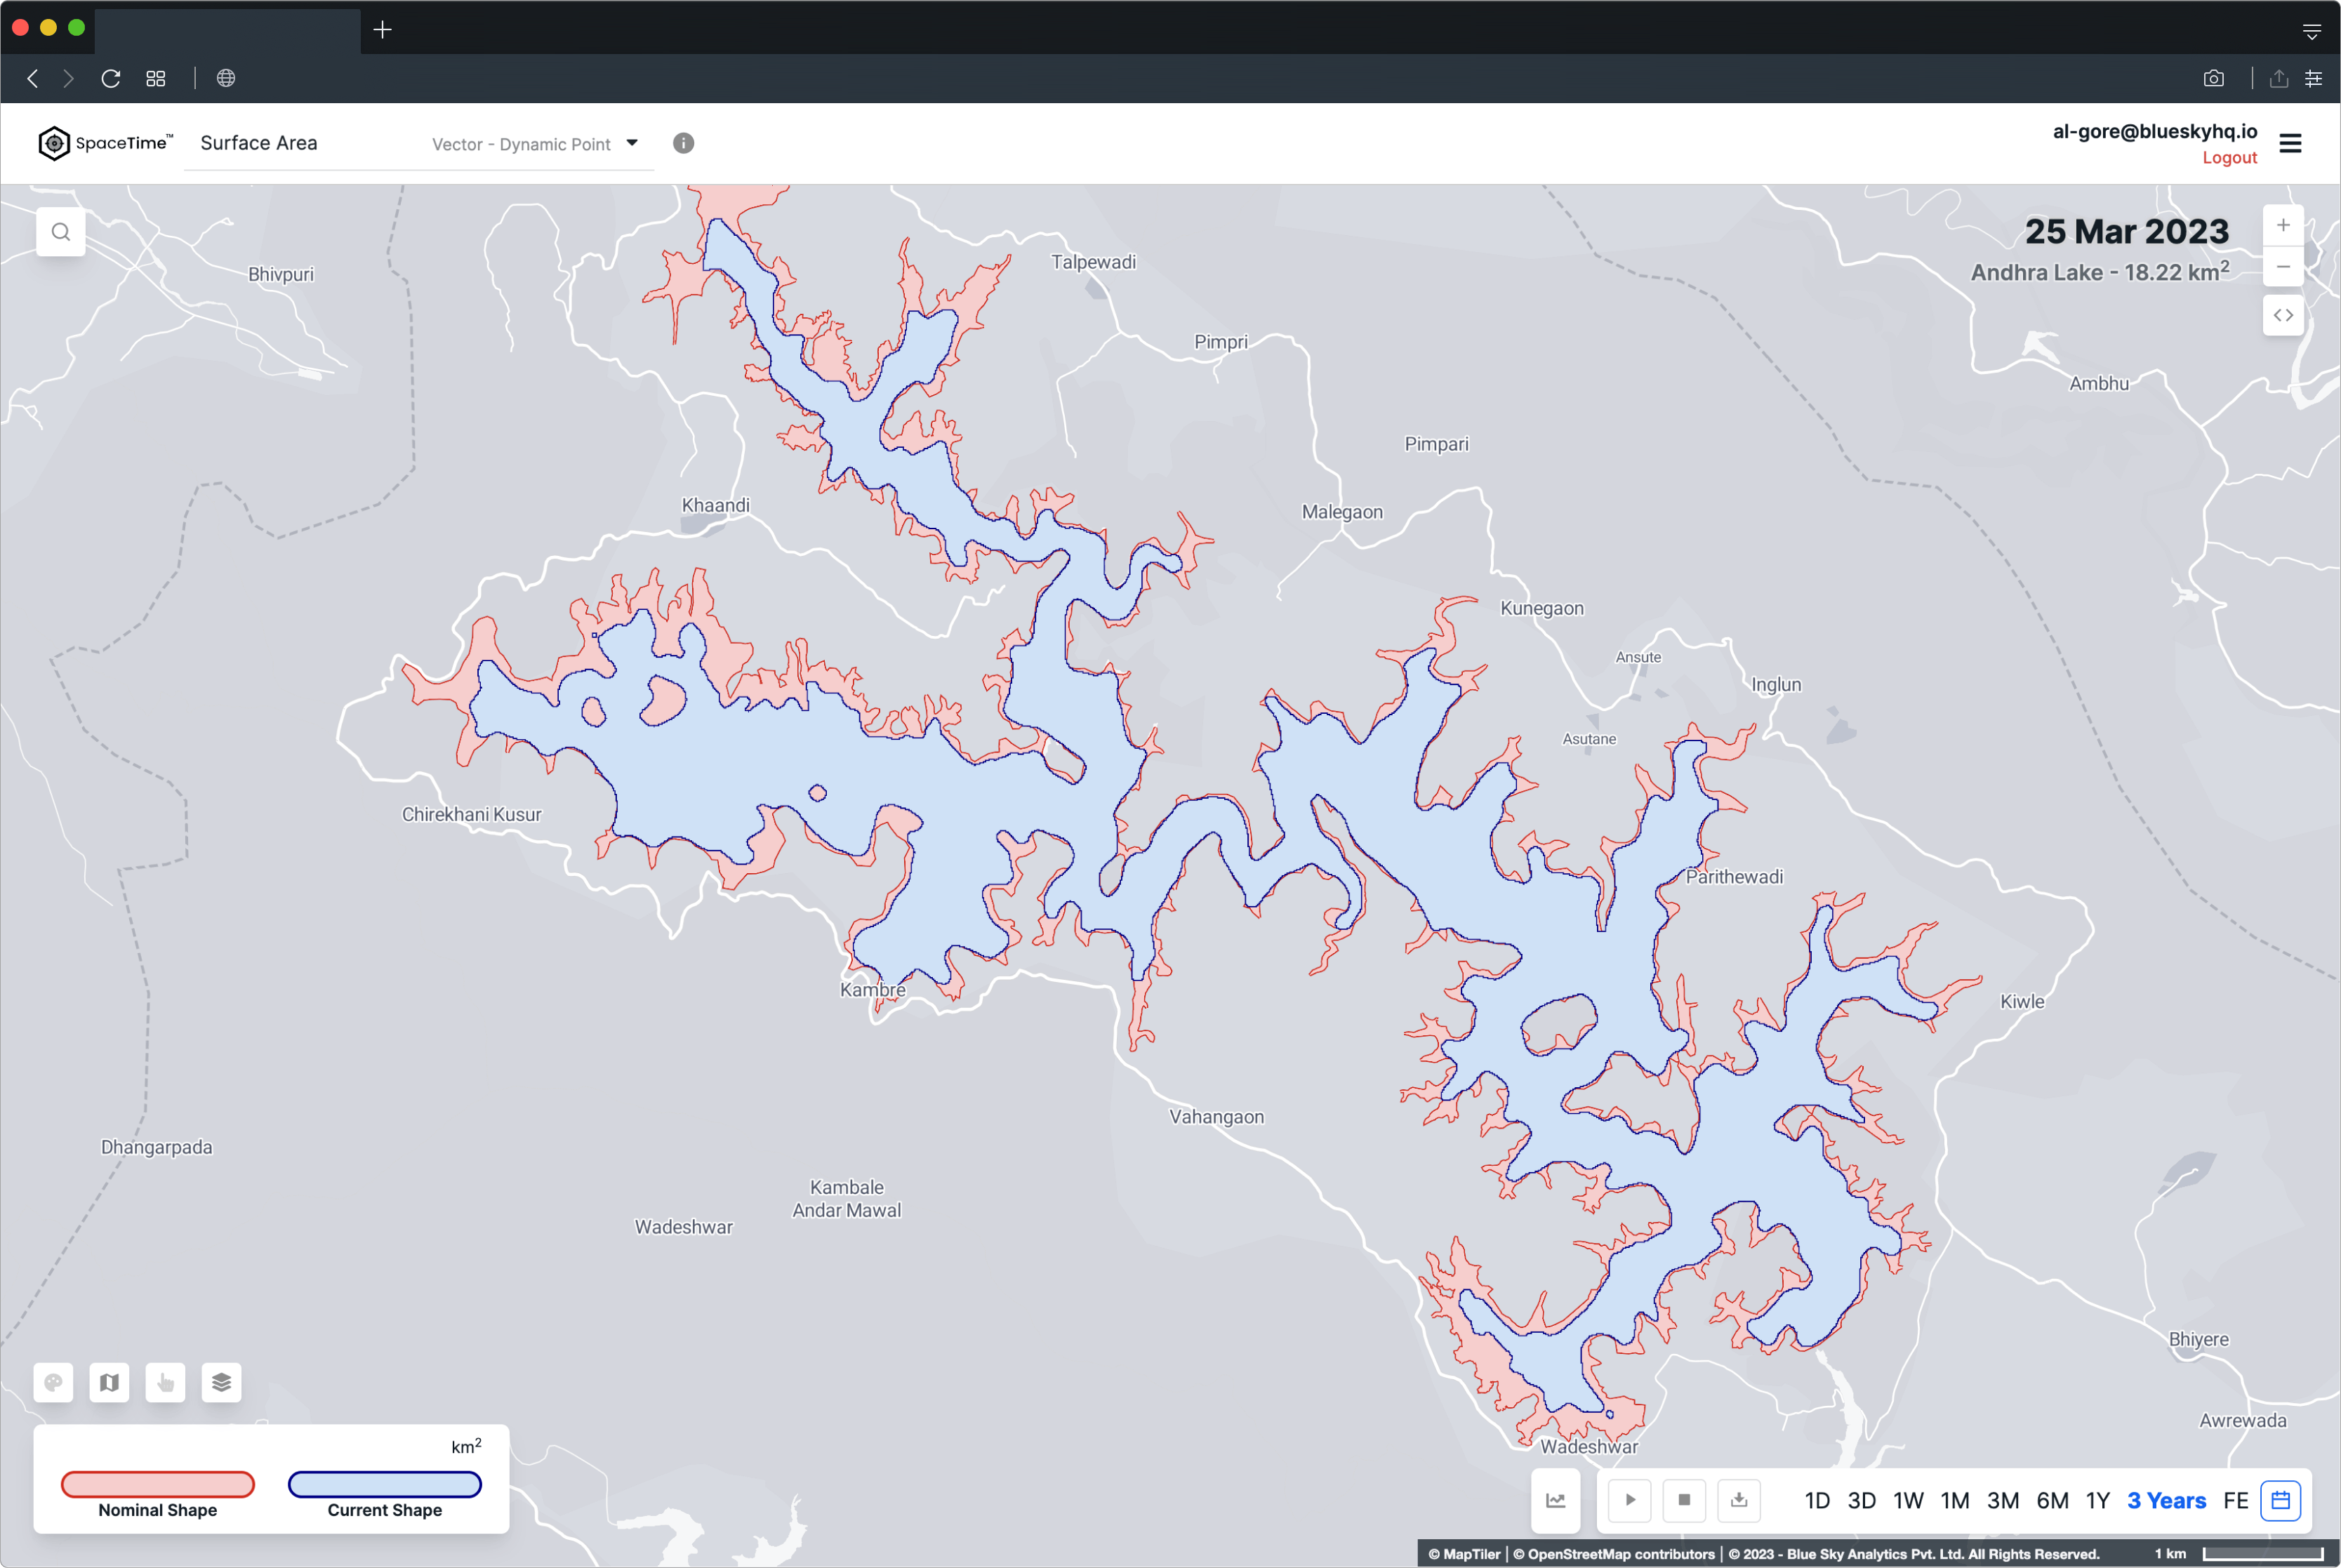
Map Visualization
Its primary function is to host various types of datasets, both vector and raster, with a focus on climate change-related datasets generated by Blue Sky Analytics.
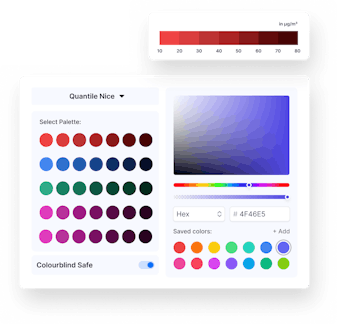
Colour Legend
Our colour legend displays the categorical representation of spatial data based on different scale functions. It is depicted using a range of numerical values that correspond to a set of colors.
Info box
Info box allow users to read about dataset in detail. It contains methodology, blogs/tutorials related to dataset and FAQs.
User Info
A logged in user can see their user information like name and email.
Colour tool
Allow users to select from our colour selector tool, which includes colour input like - HEX/RGB/HSL
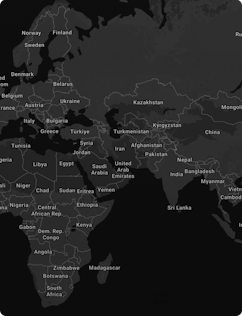
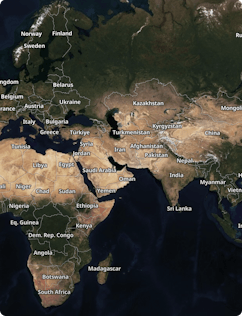
Basemap
Allow users to switch between different basemaps ranging from light, dark and satellite mode.
Embed
SpaceTime can be directly embed into external web portals. This allow different stakeholders to use our embed directly into their website.
Timelapse
Allow users to play & pause and visualize different spatial data over a set of periods directly on SpaceTime
GIF Exporter
Allow users to generate and export interactive GIFs of every datasets in few minutes and along with power to provide quality threshold
Time Bucket
Time bucketing allows users to average out set of temporal data into different time buckets such as daily, weekly, monthly, yearly, etc.
Duration Selector
Allow users to select data from different durations like 1 day, 1 week, 3 months, 1 year & more.
Custom Duration
If user don't find their required set of durations from duration selector, then they can set custom durations with help of start and end date.

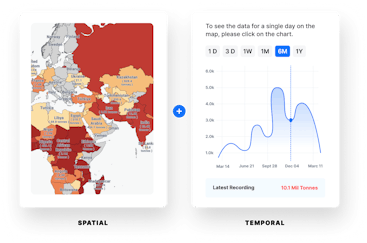
Spatial & Temporal Context
To effectively understand and utilize the vast amounts of climate data available, businesses today require a visualization platform enabling users to derive insights easily across multiple devices. Welcome to SpaceTime™ – a platform that visualises insights with detailed spatial and temporal context.
What is spacetime?
Tired of seeing endless maps and graphs?
Meet SpaceTime™, A tool that blends both to provide a seamless, complete and multi-dimensional picture of Earth.
Inspired by Albert Einstein's Special Theory of Relativity, the name SpaceTime™ can be split into two parts: space and time, which respectively represent the spatial and temporal components of everything.
Imagine it as a Digital twin of the world for climate and environmental data, where you can move around in space & time to see the future, past, or present - just like a time machine.
Visualise diverse datasets, including vector and raster data, focusing on climate-change-related parameters generated by Blue Sky Analytics. Before diving deep into APIs, Visualize the available products, or configure and use Embed or export GIFs with a single click.
Visualize any type of dataset
Build using latest Open Source Web & GIS technology


Find what's relevant to your Business
Explore and Search through a variety of datasets, each containing multiple parameters.
At Blue Sky, we use Earth Observation data, Advanced machine learning models, conventional remote sensing techniques, and cloud computing to produce high-resolution and high-frequency datasets to deliver enhanced environmental monitoring and climate risk assessment solutions.
In the past three years, we have built a technological infrastructure that allows us to produce & iterate upon a diverse range of global climate & environmental datasets that offer insights into individual assets. With this infrastructure, we can quickly develop these datasets, which help make informed decisions in response to the urgent climate crisis.


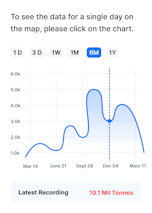
Temporal Tools

TIMELAPSE

TIME BUCKETING

DURATION SELECTOR

CUSTOM DURATION
Spatial Tools
Colour legend
Our colour legend displays the categorical representation of spatial data based on different scale functions. It is depicted using a range of numerical values that correspond to a set of colors.
Colour Scale
Colour Selector
Predefined Colour Palettes
Colourblind Safe


Choose any basemaps
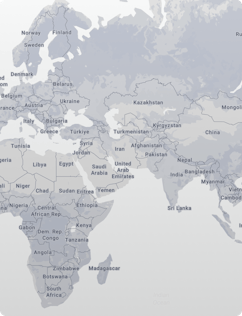
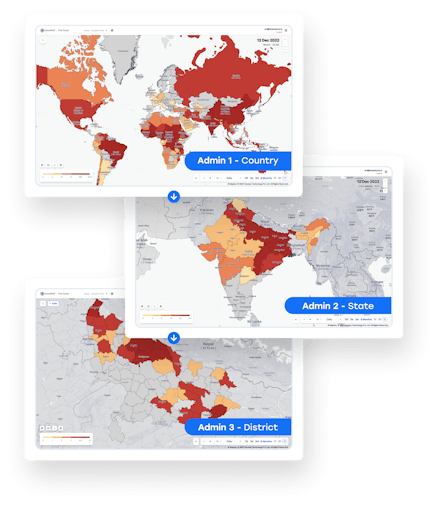
From 10,000-foot View to Microscopic details
With SpaceTime™, Explore and Aggregate insights at various administrative levels, ranging from a global view down to a single asset; Data can be aggregated based on multiple spatial buckets at different levels given below.
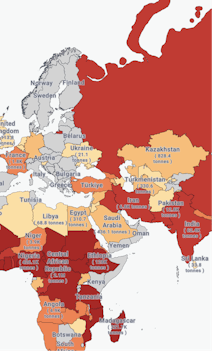
- Country: Access global datasets on critical topics such as flood, wildfires, emissions, extreme heat, water stress and carbon emissions, aggregated at the country level for high-quality macro-level understanding.
- State or Province: Track nationwide trends in various environmental parameters to inform policy development, international trade, budget allocations, etc. With precise attribution, promote transparency and accountability in decision-making processes.
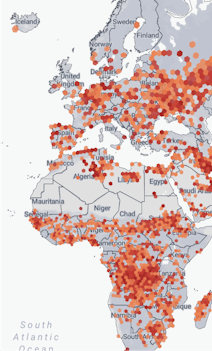
- District or County: Connect with the local communities & draw local insights to aid better management of cities & municipalities with data-driven decisions. Get detailed insights on parameters such as water assets, green cover, tree count, landfill size etc.
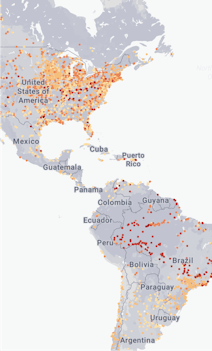
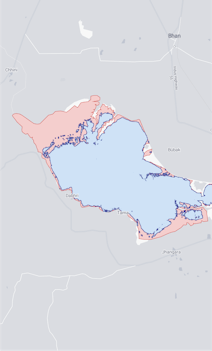
- Asset: Finally, zoom in further from a city or district view to resolutions such as 1 km², 375m², or even 50cm for Asset-level understanding.
Single Solution, Many Angles
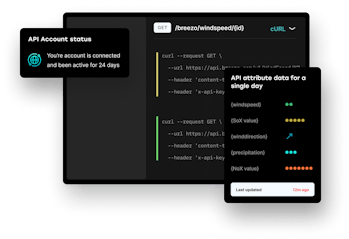
Climate Data Hub
The Climate Data Hub enables users to manage their accounts, explore the API documentation, monitor usage, and integrate with Blue Sky APIs.
- Access datasets through API in standardised formats
- Rich documentation with methodologies & science behind it
- Pay for what you use with usage-based pricing
- Integrated Billing (coming soon!)
- Track the accuracy of datasets with Metrics Monitor
- 99.99% Uptime with SLA coming soon!
Login through Single Sign On with various social login options or magic link to explore SpaceTime™ & Climate Data Hub
Embed Anywhere
SpaceTime™ can be embedded anywhere with just a few clicks.
- Select the dataset
- Configure the visualisation settings
- Generate HTML code for Embed
- Paste it into your HTML
Using Embed, you can create a seamless experience for your audience, allowing them to access the data and insights they need without leaving your website.
Embed code
Generate GIFs
Allow users to generate and export interactive GIFs of every datasets in few minutes and along with power to provide quality threshold
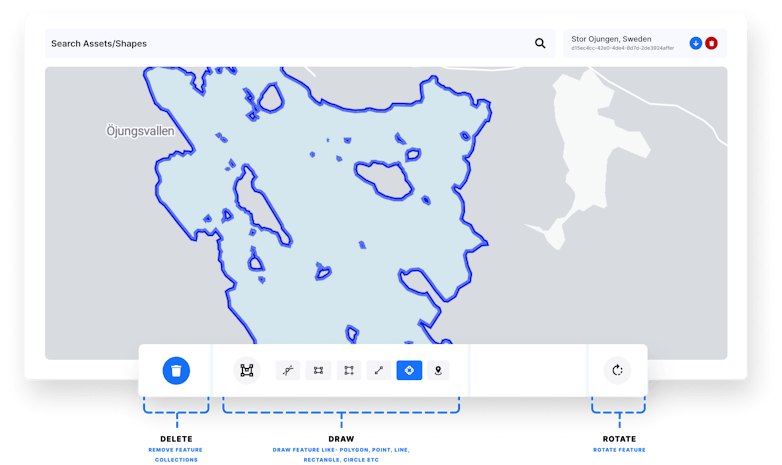
One platform for all your Assets
Draw them by hand or upload in bulk using API
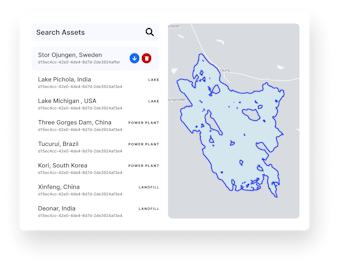
AMS - Asset Explorer
Search Assets
Allow stakeholder to search among our AMS based on different asset types.
View Assets
Select Assets
List of Assets
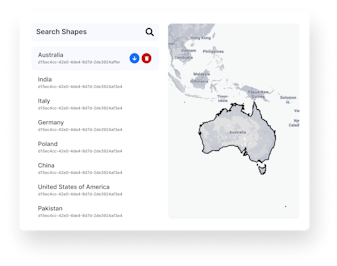
Shape Explorer
Search Shape
Search any Administrative shapes around the world in different level from country view to sub district view.
View Shape
Select Shape
List of Shape